The success of environmental water delivery is poorly measured and communicated
The Commonwealth Environmental Water Office manages about 23% of the water assets in the Murray-Darling Basin to support environmental outcomes. Similar holdings apply in other river basins. This is a huge public asset. So how well is the asset being used?
The approach to reporting on environmental water delivery could be generously described as ‘inconsistent’. As someone who has worked in the environmental water industry for over 25 years this is a great disappointment. Not because of any mismanagement, but because there has been an enormous amount of success achieved in delivering water for environmental benefit that is not being communicated.
eFlow Projector improves the communication of environmental water delivery for water managers and the broader public?
Truii has created eFlow Projector, a web application that:
- Reports on the overall success of meeting environmental flow objectives.
- Reports the relative contribution that delivered environmental water made to meeting environmental flow objectives (sometimes it rains).
- Reports on why a flow objective may not have been met by reporting the success/failure of the individual flow components (magnitude, duration, count and independence) that make up the flow objectives.
- Allows partial success of watering events to be considered (even when the total desired flow objective has not been achieved, there is often some environmental benefit).
Configuring eFlow Projector
- Identify sites (gauges) of interest within your user group’s data library and either automatically retrieve data from government water information services or upload data directly (e.g. model simulation flows).
- Configure flow rules and link them to the assessment sites in the data library.
- Create performance reports by selecting the flow rules to include in each report. The same flow rule can be included in multiple performance reports (e.g. spatially-based performance report, or by flow type performance report).
- Run flow rules individually or as a batch for a whole performance report.
- Explore the results, spatially, temporally, by flow rule type and by reporting tiers.
How the calculation works
eFlow Projector analyses daily time series of streamflow data for the prescribed season for each flow rule and reports a success score for each of the different components of the flow regime (magnitude, duration, count, independence). These component scores are aggregated to score the overall flow rule performance. These overall flow rule scores are then aggregated to provide site-based performance, and further rolled up to assess regional performance.
Who it is for
eFlow Projector is for environmental water managers to allow them to better plan upcoming watering strategies and to report on the outcomes of environmental watering.
Where it applies
eFlow Projector can be applied anywhere that you have daily streamflow data.
How you can access it
eFlow Projector is available with an annual subscription.
Learn more about eFlow Projector >>


 https://truii.com/wp-content/uploads/2024/08/EW-05-Cover-Image-New.jpg
1250
1250
Tash Venz
https://truii.com/wp-content/uploads/2017/11/truii-logo-full-colour.png
Tash Venz2025-09-25 10:17:482026-05-19 14:59:53How much of that eFlow success was due to effective water management?
https://truii.com/wp-content/uploads/2024/08/EW-05-Cover-Image-New.jpg
1250
1250
Tash Venz
https://truii.com/wp-content/uploads/2017/11/truii-logo-full-colour.png
Tash Venz2025-09-25 10:17:482026-05-19 14:59:53How much of that eFlow success was due to effective water management?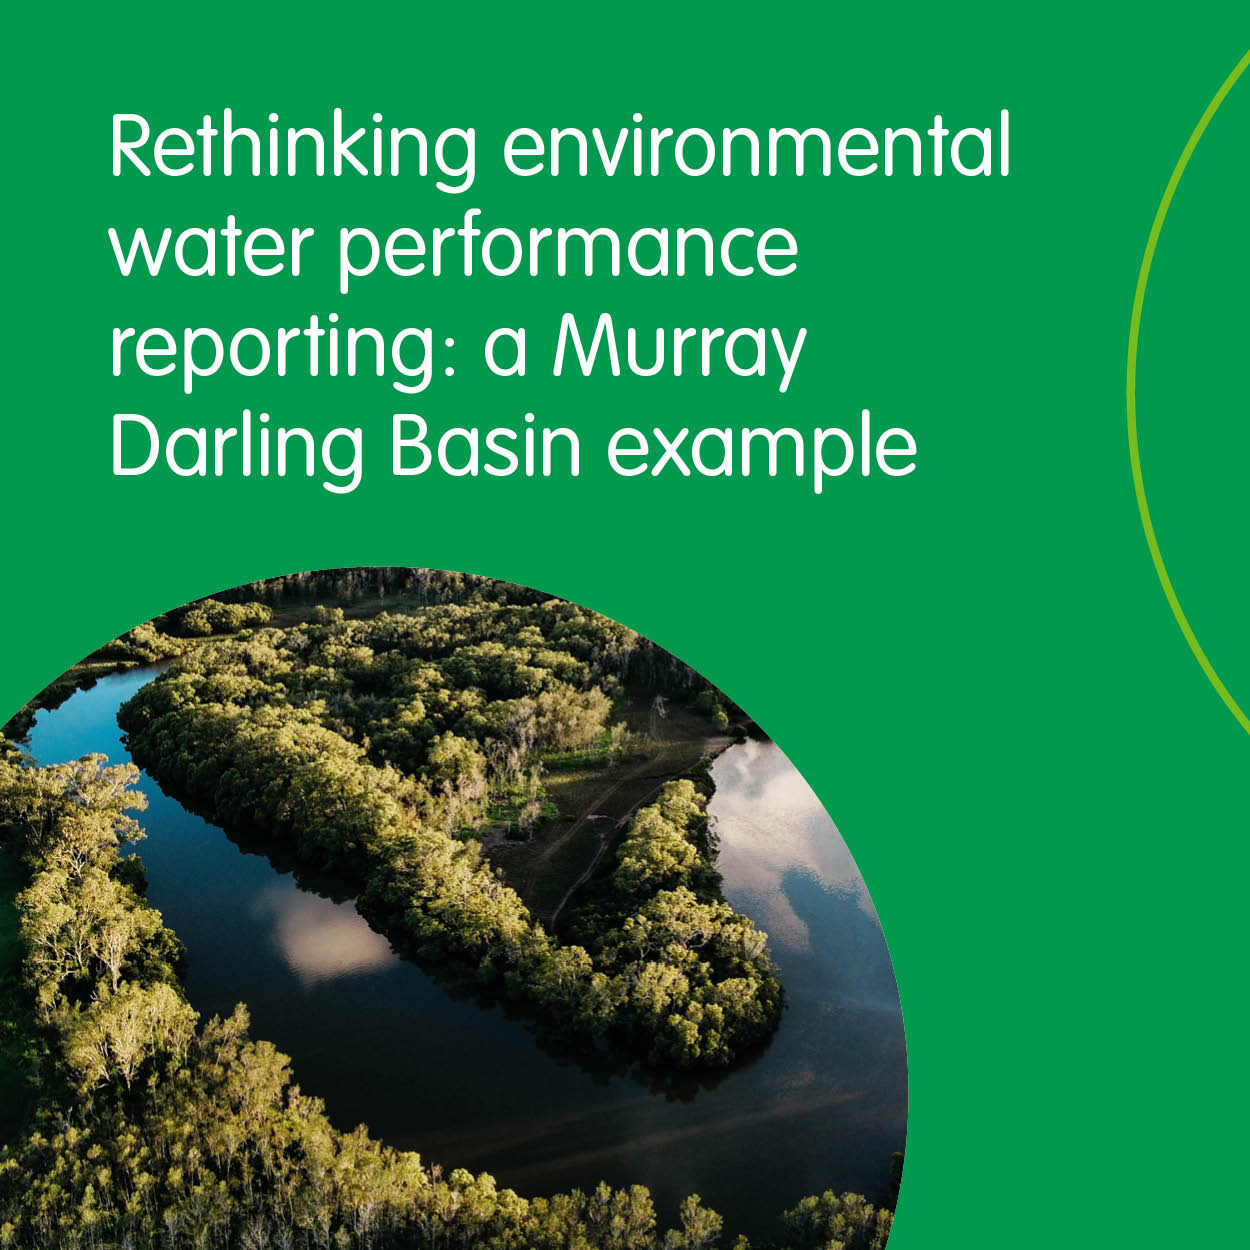


